
Upgrade Your Drupal Skills
We trained 1,000+ Drupal Developers over the last decade.
See Advanced Courses NAH, I know EnoughIntegrating R with Drupal
R programming can be an astronomical solution for foretelling re-booking rates by leveraging previous guest ratings and, thereby, automating guest/host matching. That’s exactly what analysts at Airbnb, an online marketplace and hospitality service provider, has done with it. It has leveraged R for driving numerous company initiatives with the help of an internal R package called Rbnb.

As a growing organisation, Airbnb’s inclination towards R for enhancing its business operations speaks volumes of this programming language. It offers powerful analytics, statistics and visualisations. In combination with Drupal, R programming language can be a spectacular option for an innovative solution. Let’s take a look at the origins of R and its significance before heading over to the integration of Drupal and R programming.
A sip of history
Microsoft delineates that strolling along history of R would take us back to ‘90s when it was implemented by Robert Gentleman and Ross Ihaka (faculty members at the University of Auckland). It was commenced as an open source project in 1995. R Core Group handled this project from 1997. The first version was released in the year 2000. It was closely modelled on the S language for Statistical Computing.
R programming: An exploration

R, as an open source programming language and software environment, is magnificent for statistical computing and graphics. Prominently, it is used by data scientists and statisticians alike. It has the support of R Foundation for Statistical Computing and a huge community of open community developers. Those who are accustomed to using GUI focussed programs like Statistical Package for Social Sciences (SPSS) and Statistical Analysis System (SAS) can find it difficult in the nascent stages of using R as it leverages a command line interface. In this case, RStudio can be meritorious.
R is a language and environment for statistical computing and graphics. - r-project.org
R offers a wide array of statistical techniques like linear and non-linear modelling, classical statistical tests, time-series analysis, classification, clustering among others. In addition to this, it also provides graphical techniques and is very extensible.
R has had a remarkable growth which can be seen through the following figure.
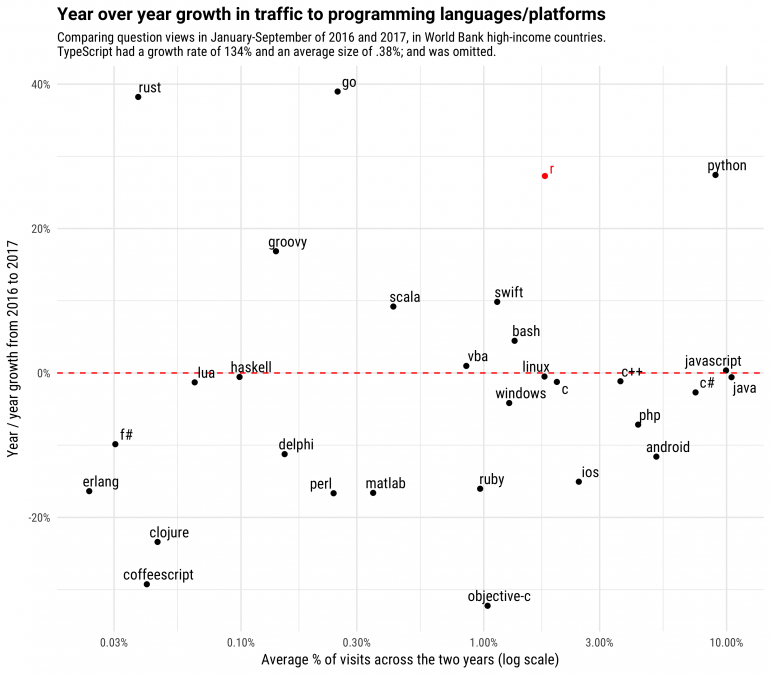 Source: Stack Overflow
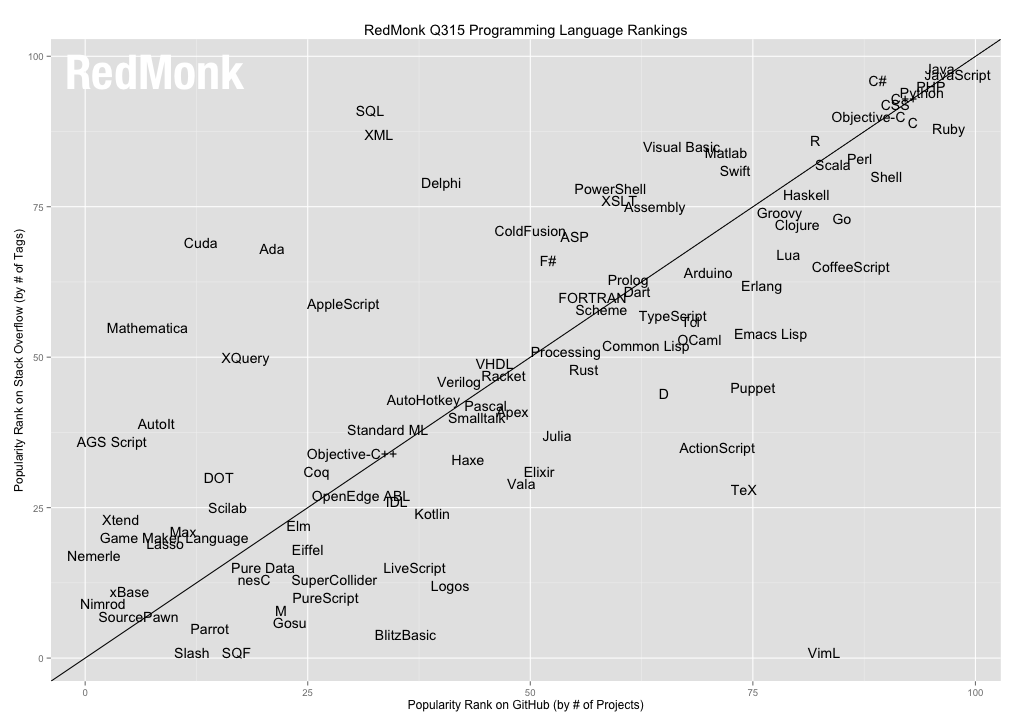
Even the Redmonk programming language rankings, that compared languages’ appearances on Github (usage) and StackOverflow (support), R maintains its position near the top.
Academics, healthcare and government segments maintain the preeminence when it comes to the industries that visit the R questions the most in U.S. and U.K.
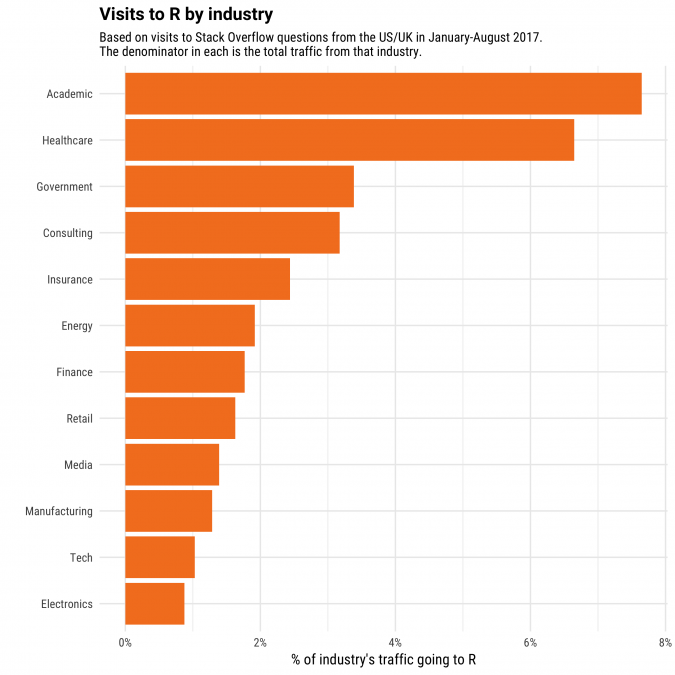 Source: Stack Overflow
The Burtch Works survey shows that R is a second choice for data scientists and its flexibility makes it great for predictive analytics. Research practitioners, who want to do both sorts of analysis and concurrently implement machine learning to their marketing research processes in future, will find R as a great option.
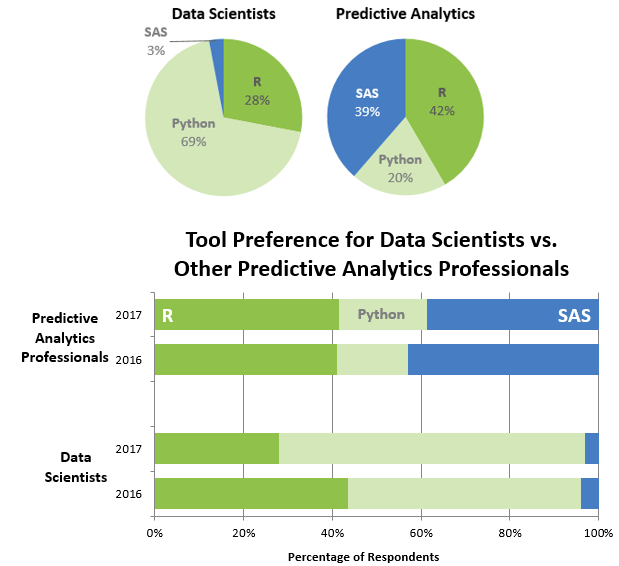 Source: Nebu
Why choose R?
Following are some of the pivotal reasons that state the importance of R:
Documentation
Online resources for R like message boards are superbly supported and well documented.
Analysis
R helps in performing data acquisition, cleaning and analysis all in one place.
Data Visualisation
R has fantastic tools for data visualisation, analysis and representation.
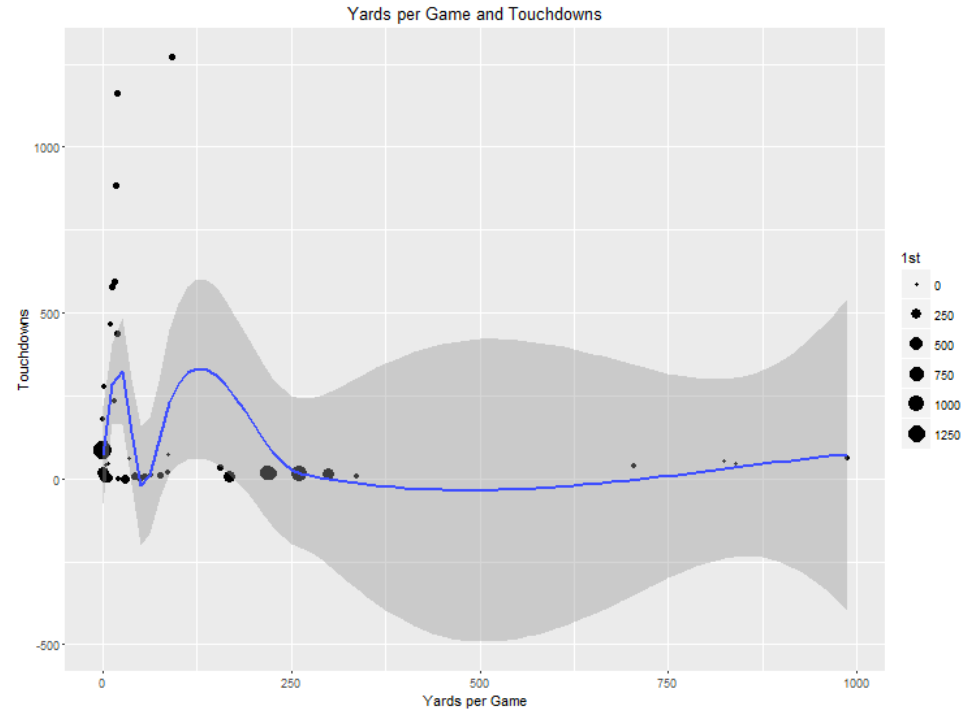 Figure: A ggplot2 result | Source: IBM
This is a good example of data visualisation provided by R package ggplot2. In this, it displays the intricate relationship between yards per game and touchdowns as well as first downs.
Easy to learn
You can quickly get to speed as R has an easy learning curve. For instance, with the simplicity of the language, you can easily create three samples and create a bar graph of that data.
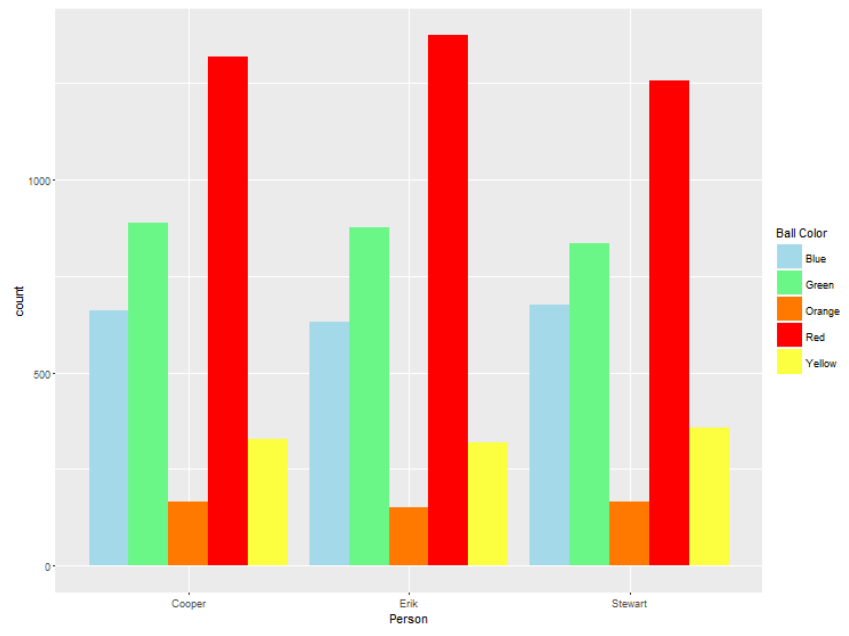 Figure: Three random samples | Source: IBM
Machine learning
It makes machine learning a lot more easy and approachable with a superabundance of R packages for machine learning like MICE (for taking care of missing values), CARET (for classification and regression training) among others.
Drupal in the picture
A digital agency integrated Drupal with R for an insurance company that envisions itself offering a highly personalised matching service to assist people for selecting the right insurance program. The company leveraged R for building an algorithm that can calculate the compatibility score. The main notion was to be able to efficaciously match prospective customers to the insurance carrier based on customer’s needs and preferences.
The company leveraged R for building an algorithm that can calculate the compatibility score to be able to efficaciously match prospective customers to the insurance carrier based on customer’s needs.
The intricacies involved during the calculation of the compatibility score that is a function of elements like user persona, price sensitivity among others. So, numerous unique customer personas were found in the process like demographic factors (gender, age, education etc.) and car ownership details (car type, mileage etc.). Once a prospect is found to be a particular persona, it is, then, mapped to each of the insurance providers on the basis of a score and customer satisfaction survey ratings.
Moreover, different scores are calculated for tracking sensitivity of the customer to price, customer service levels, etc. This is done through a web service that links to the insurance carriers’ information and offers a quote for the customer on the basis of numerous information points provided by him. Finally, consolidation of all these scores into two different parameters give a final score that helps the prospect to select the right insurance carrier.
An insurance portal was built in Drupal which was the customer persona questionnaire that prospects can fill to be able to search the best carrier for their spending styles and other preferences. Once the information is entered by the prospect, it is passed from Drupal to R in the JSON format. R ensures that a plethora of customer data already exist and are also leveraged by the algorithm developed. Quotes pulled from multiple carriers are processed via web service. On the basis of the algorithm, R processes all the data and sends back the best carrier match options for the prospect who can, then, select the carrier on the basis of his preferences.
Conclusion
R, along with Drupal, is a marvellous option for the data experts to do everything ranging from the mapping of social and marketing trends online to building financial and climate models for giving that extra push to our economies and communities.
We have been offering a suite of services for fulfilling the digital transformation endeavours of our partners.
Let us know at [email protected] how you want us to be a part of your digital innovation plans.
About Drupal Sun
Drupal Sun is an Evolving Web project. It allows you to:
- Do full-text search on all the articles in Drupal Planet (thanks to Apache Solr)
- Facet based on tags, author, or feed
- Flip through articles quickly (with j/k or arrow keys) to find what you're interested in
- View the entire article text inline, or in the context of the site where it was created
See the blog post at Evolving Web